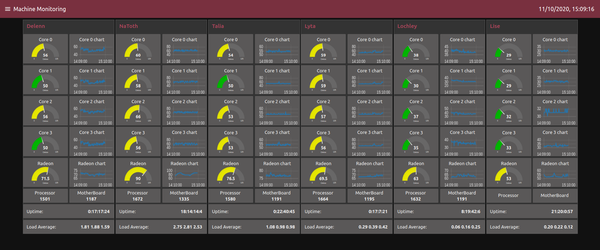
IoT - IT Hardware Monitoring with Node-Red
I run Linux here...
This means that most of my instructions will be Linux-based. But, If I work out how to do things under Windows or Mac, I'll try to write those up as well.
Contents
Getting the information from the hardware
Sensor data
lm-sensors 3.6.0 does JSON output (w00t w00t)
Mosquitto can be given the JSON output from lm-sensors
(This may be just a little TOO easy... :P )
/usr/bin/mosquitto_pub -h automation.DOMAIN.TLD -t MachineName -m "`/usr/local/bin/sensors -j`"
This, of course, can be run by cron. On my machines, I've told cron to run it once per minute.
* * * * * /usr/bin/mosquitto_pub -h automation.DOMAIN.TLD -t MachineName -m "`/usr/local/bin/sensors -j`"
Other data
Pretty much anything you can persuade your machine to spit out as plain text can be turned into MQTT messages using your scripting language of choice. (or even get hard-core & write some full-on code.)
The /proc filesystem is an excellent source of system information. (One heck of a rabbithole to dive down can be found by typing man proc into a terminal.)
I have a little script on my machines to spit out stats. It formats the output as JSON to be transferred via MQTT. The following scripts spit out individual parts. My script (WIP) is a combination of them all.
uptime
 1 # Get uptime
 2 if [ -f "/proc/uptime" ]; then
 3 uptime=`cat /proc/uptime`
 4 uptime=${uptime%%.*}
 5 seconds=$(( uptime%60 ))
 6 minutes=$(( uptime/60%60 ))
 7 hours=$(( uptime/60/60%24 ))
 8 days=$(( uptime/60/60/24 ))
 9 fi
10
11 printf '{\n\t"uptime":"%s:%s:%s:%s",\n}\n' "$days" "$hours" "$minutes" "$seconds"
Load Averages
1 # Get loadavg
2 if [ -f "/proc/loadavg" ]; then
3 OneMin=`cat /proc/loadavg | cut -b 1-4`
4 FiveMin=`cat /proc/loadavg | cut -b 5-9`
5 FifteenMin=`cat /proc/loadavg | cut -b 11-14`
6 fi
7
8 printf '{\n\t"loadavg":"%s %s %s"\n}\n' "$OneMin" "$FiveMin" "$FifteenMin"
Combining These
 1 # Get uptime
 2 if [ -f "/proc/uptime" ]; then
 3 uptime=`cat /proc/uptime`
 4 uptime=${uptime%%.*}
 5 seconds=$(( uptime%60 ))
 6 minutes=$(( uptime/60%60 ))
 7 hours=$(( uptime/60/60%24 ))
 8 days=$(( uptime/60/60/24 ))
 9 fi
10
11 # Get loadavg
12 if [ -f "/proc/loadavg" ]; then
13 OneMin=`cat /proc/loadavg | cut -b 1-4`
14 FiveMin=`cat /proc/loadavg | cut -b 5-9`
15 FifteenMin=`cat /proc/loadavg | cut -b 11-14`
16 fi
17
18 printf '{\n\t"uptime":"%s:%s:%s:%s",\n' "$days" "$hours" "$minutes" "$seconds"
19 printf '\t"loadavg":"%s %s %s"\n}\n' "$OneMin" "$FiveMin" "$FifteenMin"
This gets saved as /usr/local/bin/MQTTstats.sh & made executable.
Then added into your crontab (again... once/minute.)
* * * * * /usr/bin/mosquitto_pub -h automation.DOMAIN.TLD -t MachineNameSTATS -m "`/usr/local/bin/MQTTstats.sh`"
Dealing with the information in Node-Red
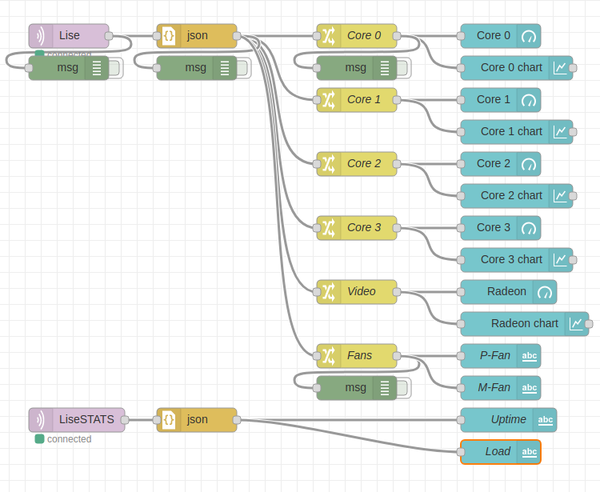
Bringing all of this information into Node-Red is simply a matter of capturing the MQTT messages.
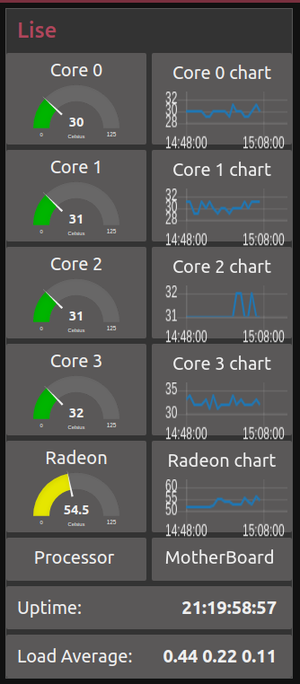
Displaying this information is a little more complicated.
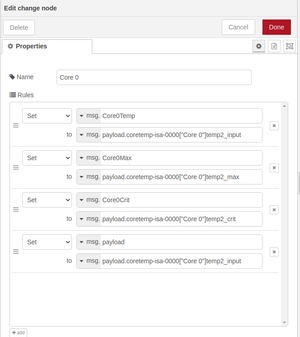
Parsing out the Core Temps is done in a change node:
The guage nodes get their data from {{msg.Core0Temp}}
Sadly, the chart nodes only seem to work with msg.payload
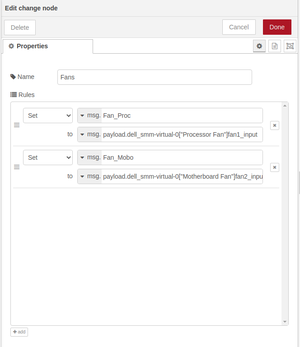
Similarly, for the Fans:
Their data comes from {{msg.Fan_Proc}} & {{msg.Fan_Mobo}}
